

 Tracking the Online Conversation
By Dan Bolton
Matcha commands far more online attention than some of tea’s best-known origins. The first Matcha Mentions report quantifies that gap and establishes a baseline for tracking the conversation.
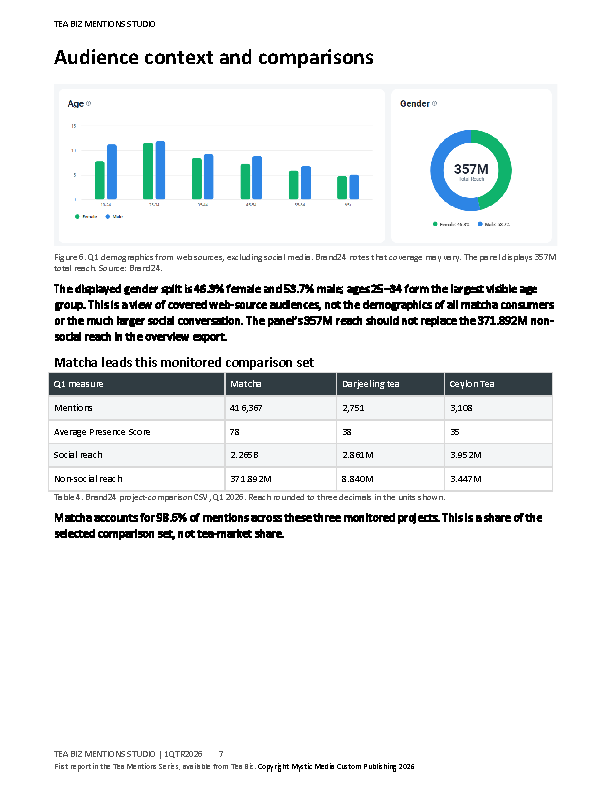
For the reporting period from January 1 to June 30, 2026, Brand24 recorded 956,651 mentions of matcha, compared with 6,729 for Ceylon tea and 6,392 for Darjeeling tea. That is roughly 142 and 150 times as many mentions, respectively. The comparison reflects conversations captured by Brand24, not tea consumption or sales.
I analyzed the Brand24 data after applying an English-language filter. TikTok is an exception: the platform cannot always determine the language of mentions containing little more than hashtags and a few words.
The dashboard records an estimated total reach of 5.73 billion and more than 362 million social media interactions. Matcha’s average Presence Score was 78 out of 100, compared with 39 for Darjeeling and 35 for Ceylon. Presence Score is Brand24’s measure of online visibility; reach estimates potential exposure, rather than a verified audience of distinct people.
These figures give tea businesses reason to pay attention. Matcha appears on café menus, in creators’ posts, in recipes, and in wellness discussions, reaching beyond conversations about tea itself. The comparison with Ceylon and Darjeeling illustrates the scale of that attention, though it does not establish matcha’s position against every tea or other beverage.
That visibility also raises a question for the trade: how might matcha fare as people discover products through social media, AI-generated search results, and conversational assistants? Online mentions offer a starting point for examining that question. They do not, by themselves, show how often AI systems recommend matcha or whether those recommendations lead to purchases.
This inaugural report establishes a benchmark for tracking matcha’s online presence. Future quarterly editions will follow changes in the conversation and examine what they may mean for consumer awareness, retail demand, and tea’s competitive position. The task is to understand how the attention recorded here relates to the choices consumers make.
Click to download the benchmark Matcha Mentions report (free)
The inaugural Q1 2026 Matcha Mentions Report is now available as a free download. Covering January 1 through March 31, the report establishes the baseline for quarterly comparisons throughout 2026. Q2 and Q3 reports will follow, along with a special half-year analysis and an annual report in January 2027.
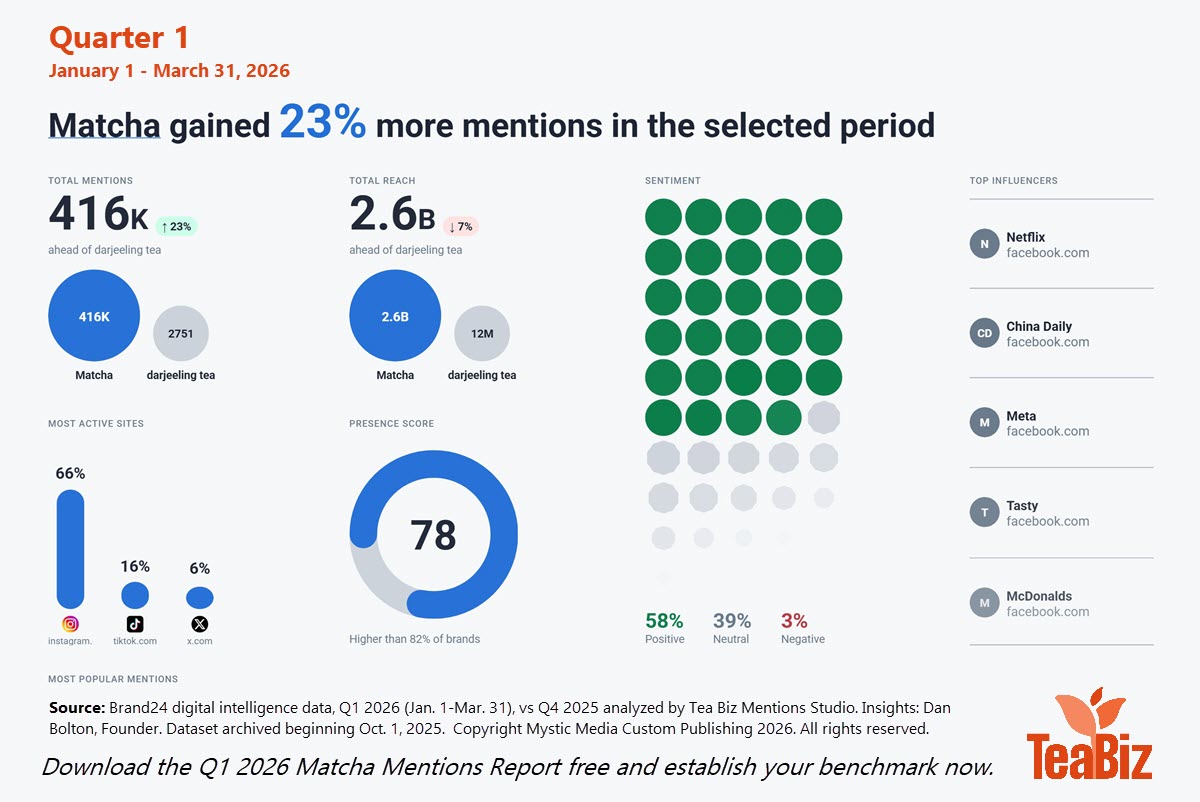
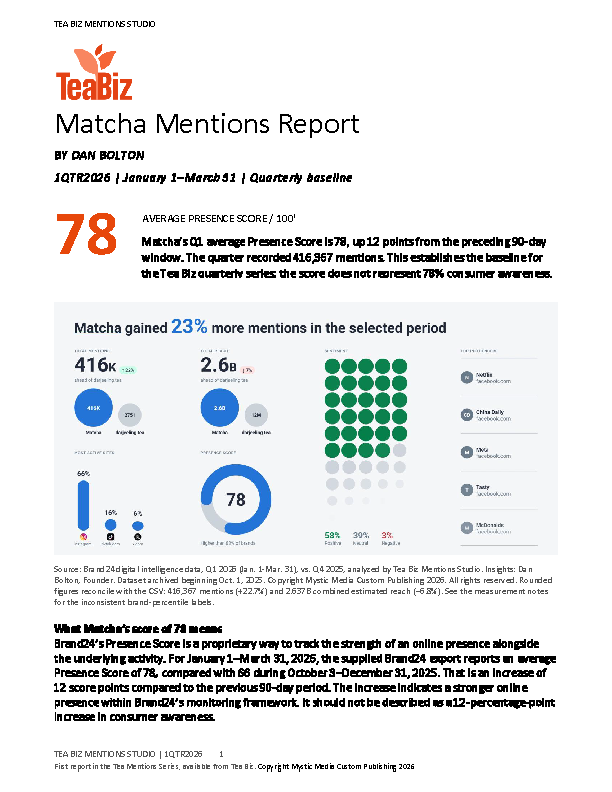
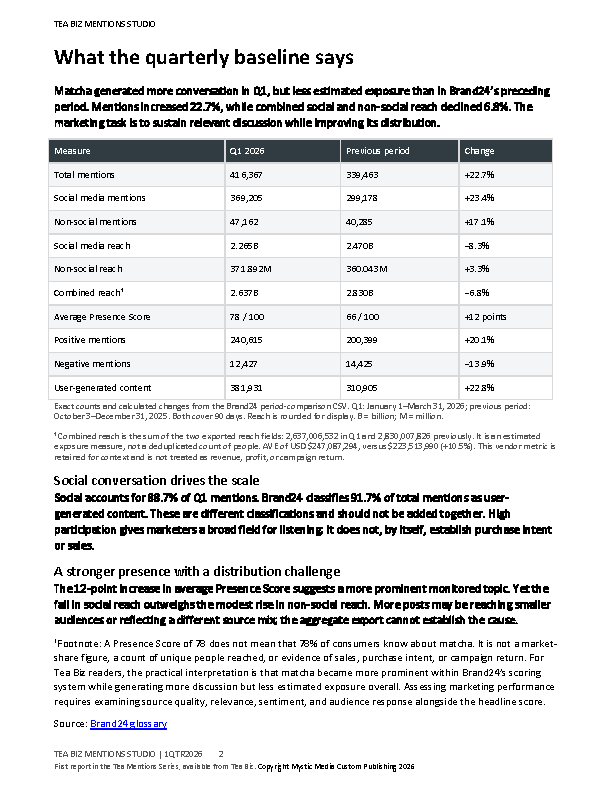
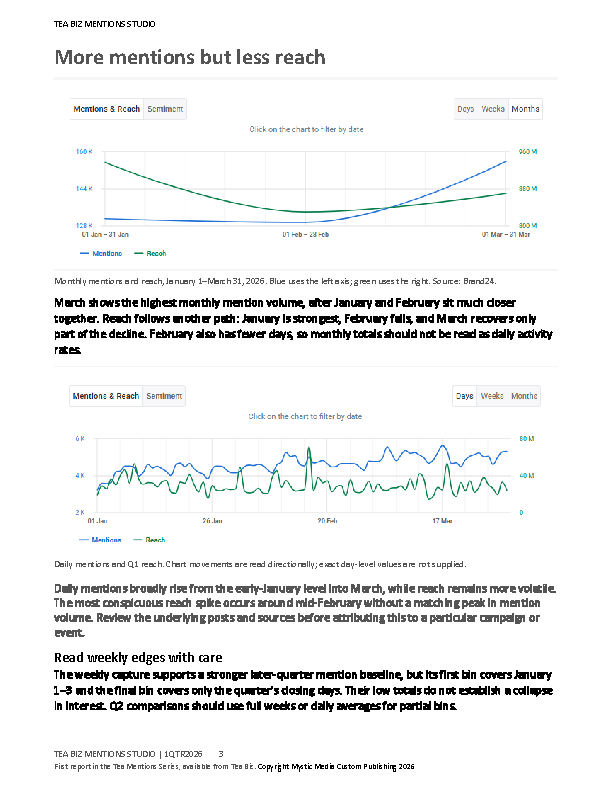
The first quarter recorded 416,367 matcha mentions, up 22.7% from the preceding 90-day period. Yet estimated combined reach declined 6.8% to 2.637 billion. Matcha’s average Brand24 Presence Score climbed from 66 to 78 out of 100. The contrast is significant: the online conversation grew substantially even as its estimated distribution narrowed.
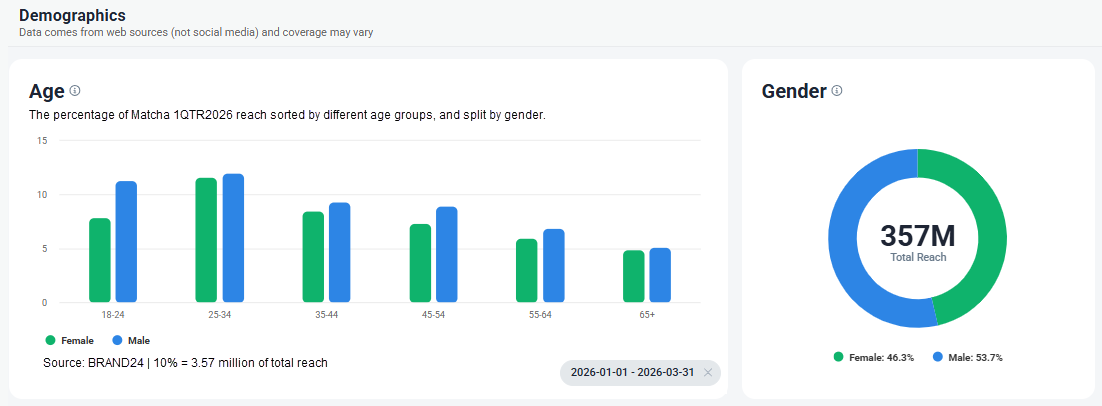
The report looks beyond headline volume. It examines where matcha conversations occur; which platforms drive discussion versus reach; sentiment and emotions; trending hashtags; audience characteristics; influential voices; and when conversation, reach, and interaction peak.
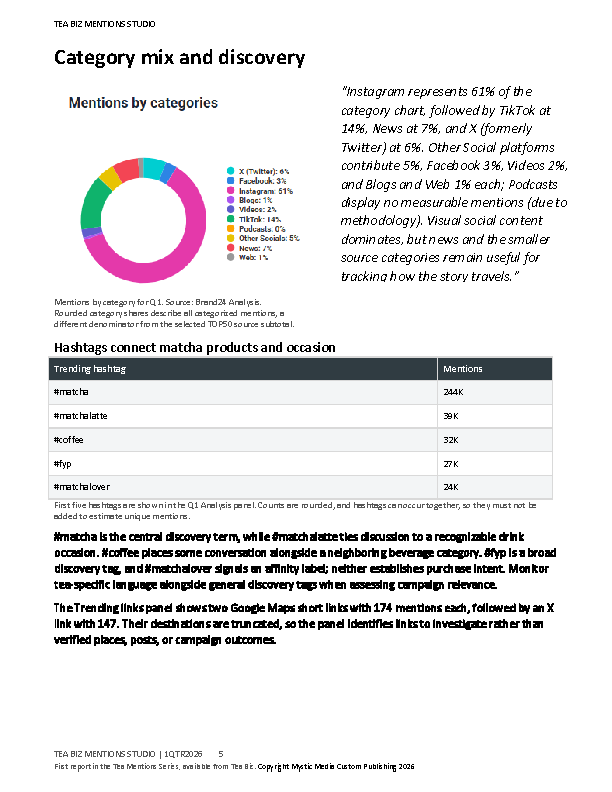
 The platform data reveal some striking differences. Instagram leads conversation volume, while TikTok leads estimated exposure. Among the TOP50 sources analyzed, Instagram generated approximately 254,000 mentions, while TikTok generated about 60,000 mentions but an estimated 1.6 billion reach. Only 18 sources appeared in both the TOP50 lists for mentions and reach—demonstrating why visibility cannot be understood from mention counts alone.
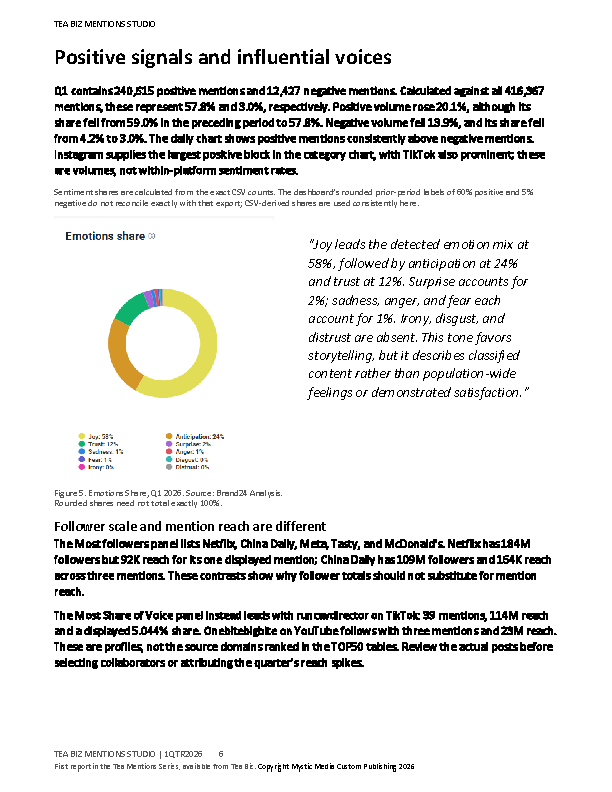
Sentiment provides another dimension. Q1 contained 240,615 positive mentions compared with 12,427 negative mentions. Joy accounted for 58% of the detected emotion mix, followed by anticipation at 24% and trust at 12%. These measures describe the content Brand24 captured rather than consumer attitudes or purchasing behavior, but they provide a benchmark for comparing subsequent quarters.
That longitudinal comparison is the purpose of Matcha Mentions. Q1 establishes the starting point. Q2, Q3, and subsequent reports will show whether conversation is accelerating or cooling, where attention is migrating, which sources are gaining influence, and whether matcha’s extraordinary digital visibility is being sustained.
Download the Q1 2026 Matcha Mentions Report for free and establish your benchmark now.
Matcha Mentions Report 1QTR2026 V2 Lorez
Matcha Mentions Report 1QTR2026 V2 Hirez
A working baseline
Tea Biz offers Q2 and separate half-year and annual reports
This is Tea Biz’s first quarterly Matcha Mentions Report. The 2QTR2026 report will compare April 1–June 30 with the January 1–March 31 baseline. Q2 has 91 days versus Q1’s 90, so include daily averages alongside totals when duration affects interpretation.
Tea Categories include Darjeeling, Ceylon, and Matcha.
Custom reports are available for a fee. Contact Dan Bolton at Dan.Bolton@teajourney.pub for details
A separate YTD report will cover January 1–June 30, 2026.
Measurement and source notes
Quarter totals are drawn from the two Brand24 Overview CSV exports included with this report. Trend, demographic, and source-ranking captures are filtered to January 1–March 31, 2026. The previous-period export covers October 3–December 31, 2025, not the full calendar fourth quarter. Comparisons to that window provide context; Q1 remains the series baseline.
The replacement infographic’s rounded totals reconcile with Q1. The earlier 19%-growth infographic is filtered to January 30–March 31 and is excluded. The replacement’s 82% brand-percentile label differs from the Analysis panel’s 88%; use the exported average Presence Score of 78 as the reproducible quarterly benchmark. The Analysis trend ranges from about 76 to 79 and ends at 78; its current score is distinct from the quarterly average.
TOP50 calculations use only the first 50 displayed rows from each source list. K, M, and B values are rounded dashboard figures; derived subtotals and concentration shares are approximate. Preserve the displayed order for ties. A source absent from one TOP50 is outside that selected list, not necessarily absent from the broader monitored conversation.
Mentions count captures content, not unique people, purchases, or endorsements. Reach estimates potential exposure; site visits describe the source audience scale. Sentiment classifies captured content and is not a representative consumer survey. For future comparisons, retain the monitoring query, exclusions, language and location filters, time zone, and export date for each reporting window.
Sources: Brand24 Overview.csv; Overview.csv; Q1 Analysis compares the Q4 2025 dataset first archived Oct 1, 2025. Brand24 captures daily, weekly, and monthly mentions/reach; project and period comparison captures; demographics; both source rankings; and matcha-infographic.jpg. Hot Hours: the three Q1 London-time captures for Mentions, Reach, and Interactions.